Cutting an LLM bill by up to 90% rarely comes from one technique – it comes from stacking twelve complementary layers that each attack a different source of waste, then compound.
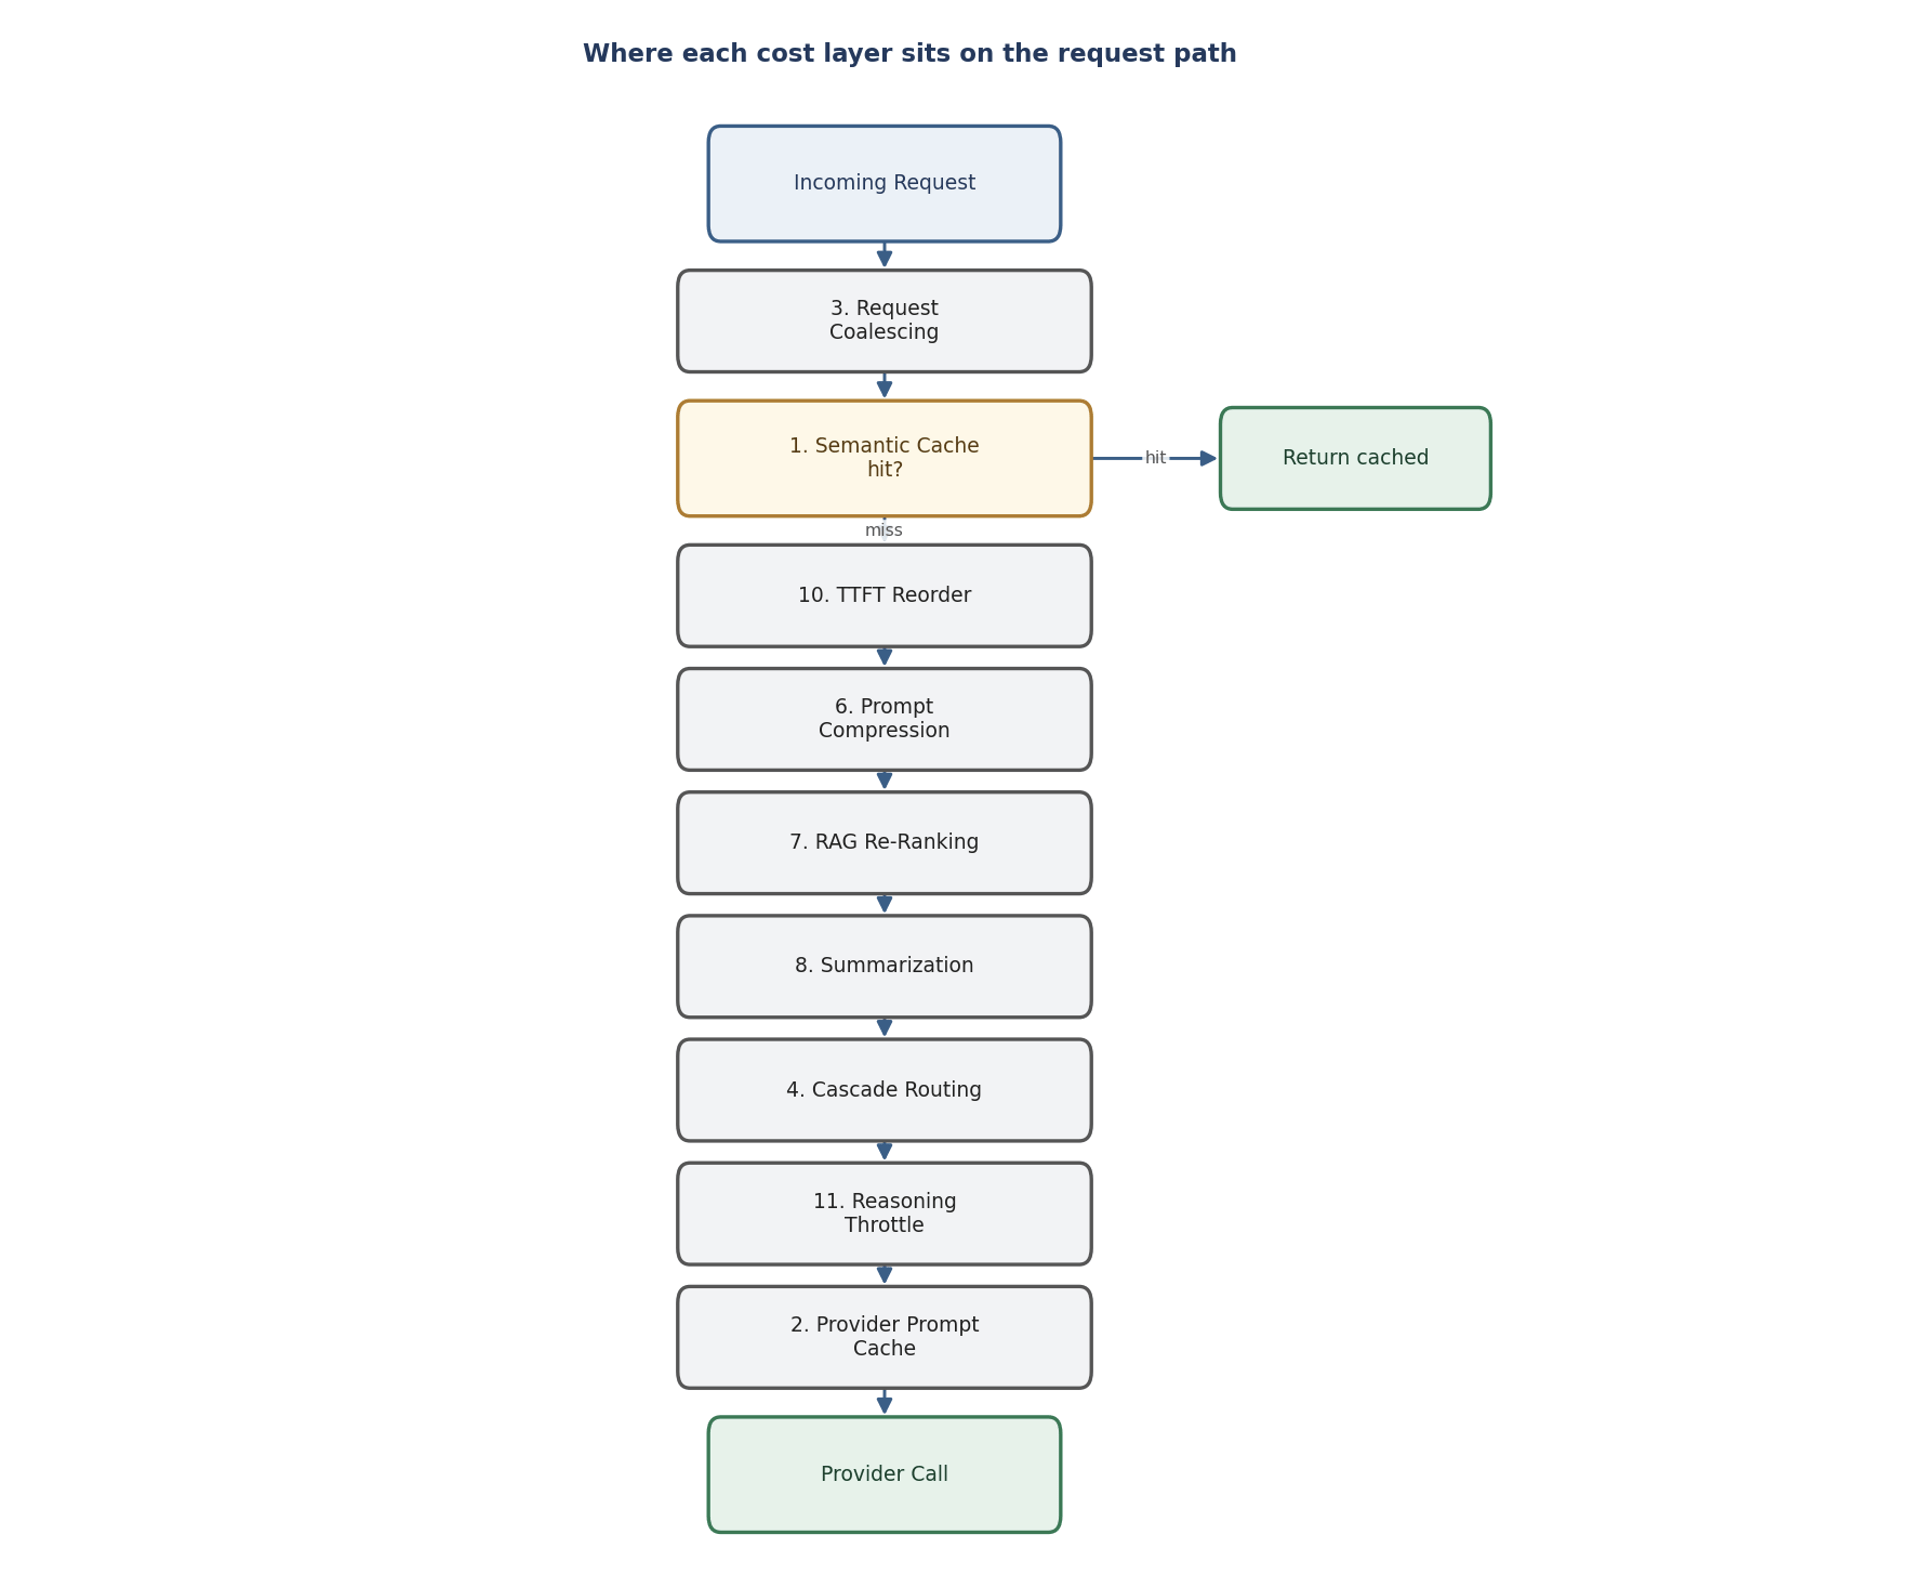
A semantic cache hit skips a call entirely; a miss still picks up the provider’s prompt-cache discount; a long context gets compressed before it’s sent; a reasoning model runs at the right effort tier instead of always-maximum. This post walks through all twelve, shows how they stack, and tells you which to switch on first.
Why one technique isn’t enough
Most teams trying to control LLM spend reach for caching, see a modest bump, and stop there. Caching is the right place to start – but it only tackles one kind of waste: repeated requests. The rest are still sitting there: oversized prompts, premium models doing trivial work, reasoning models burning tokens on easy tasks, retrieved context full of irrelevant chunks, conversation histories that grow forever. Each needs its own fix. The 90% figure comes from hitting all of them at once, in a stack where the savings multiply instead of just adding up.
If a cache hit saves 100% on a request, prompt compression saves 70% on a miss, and cascade routing sends that miss to a model costing 90% less – those don’t add up to more than 100%. They compound down into a small fraction of the original bill.
The twelve layers at a glance
Layer | Attacks this waste | Typical savings |
1. Semantic cache | Repeated and near-duplicate requests | 30–60% hit rates in support/RAG/FAQ |
2. Provider prompt caching | Re-sending the same prompt prefix | ~50/90/75% off cached input (OpenAI/Anthropic/Gemini) |
3. Request coalescing | Identical concurrent requests during spikes | Eliminates duplicate in-flight calls |
4. Cascade routing | Premium models doing low-stakes work | 60–80% of traffic to cheaper models |
5. Batch API tagging | Real-time pricing on non-urgent work | ~50% provider batch discount |
6. Prompt compression | Oversized prompts and long RAG contexts | 3–20× context reduction, <2% quality loss |
7. RAG re-ranking | Irrelevant retrieved chunks in context | 40–70% context size reduction |
8. Conversation summarization | Unbounded multi-turn history growth | 5–10× smaller payloads after turn 10 |
9. Parallel tool execution | Serial wall-clock time on tool calls | Latency reduction (throughput, not tokens) |
10. TTFT prefix reordering | Cache-unfriendly message ordering | Higher prompt-cache hit rate |
11. Reasoning-effort throttling | Max-tier reasoning on simple tasks | 30–70% off reasoning-token spend |
12. Guardrail eval caching | Re-evaluating identical safety checks | 15–35% of spend in heavy-policy setups |
The four you turn on first
The twelve don’t carry equal weight or equal effort. Start with the four that are low-risk and high-yield:
- Semantic cache – the single biggest lever for most workloads. Repeated questions stop reaching the provider at all.
- Provider prompt caching – nearly free to turn on – you just inject the provider’s cache hints. Big savings on any workload with a stable system prompt or RAG prefix.
- Request coalescing – no downside; it de-dupes identical concurrent calls during traffic spikes.
- Cascade routing – send low-stakes traffic to cheaper models. The biggest win on mixed workloads where not everything needs your best model.
These four alone often get you into the 40–50% range. The other eight push toward 90% as you tune them to your workload.
🔗 Internal link: Link each layer name to its dedicated post: semantic cache → Post 10, prompt compression → Post 11, RAG re-ranking → Post 12, reasoning throttling → Post 13, provider prompt caching → Post 14, cascade routing → Post 15, conversation summarization → Post 16.
Why a drift sampler makes the stack safe
The objection to aggressive cost optimization is always quality: “if you compress my prompts and route to cheaper models, won’t the output get worse?” The answer is to measure, not guess. Every layer should ship with a drift sampler – a configurable slice of traffic that skips the optimization and runs against the un-optimized baseline, so you can compare quality continuously. You roll out each layer only once the sampler shows the quality delta is acceptable. That’s the difference between “we turned on cost optimization and broke the chatbot” and “we turned it on, watched the sampler for three days, and rolled out with evidence.”
The bottom line
Ninety percent isn’t a marketing number – it’s what’s reachable when twelve independent optimizations compound on a workload with the typical shape: repeated questions, stable prefixes, mixed task difficulty, long contexts, over-provisioned reasoning. Few workloads hit the full ninety; most land somewhere between forty and ninety depending on their shape. The way to find out where you land is to deploy the four easy layers, measure, then add the rest with a drift sampler watching quality the whole way.
🔗 Internal link: Primary CTA: /platform/cost-optimization/. This is the Cluster 2 pillar – posts 10–16 all link up here.
How DeepintShield approaches this
DeepintShield runs all twelve layers as one stack: semantic caching, provider prompt caching, request coalescing, cascade routing, batch tagging, prompt compression, RAG re-ranking, conversation summarization, parallel tool execution, TTFT prefix reordering, reasoning-effort throttling, and a guardrail-evaluation cache – each with a drift sampler so you can check quality as you roll it out. Because the layers live in one gateway, their savings compound instead of making you integrate twelve separate tools. If you’re trying to get from a modest caching win toward the full reduction, DeepintShield is one way to deploy the whole stack with quality measured the whole way.