Skip to content

Meet DeepintShield at Bengaluru Tech Summit 2026, 17 to 19 November, BIEC Hall 1, booth H1A106. Book 20 minutes
Start For Free

Platform · Observability & Audit

LLM observability with a tamper-evident audit trail

LLM observability shows what your AI systems are doing: requests, tokens, cost, latency, agent runs, tool calls and policy verdicts. DeepintShield records them on the request path, exports metrics and traces through OpenTelemetry and Prometheus, and keeps agent decisions in a hash-chained ledger you can verify.

  • OpenTelemetry and Prometheus
  • Verify chain in the console
  • 730-day evidence retention by default
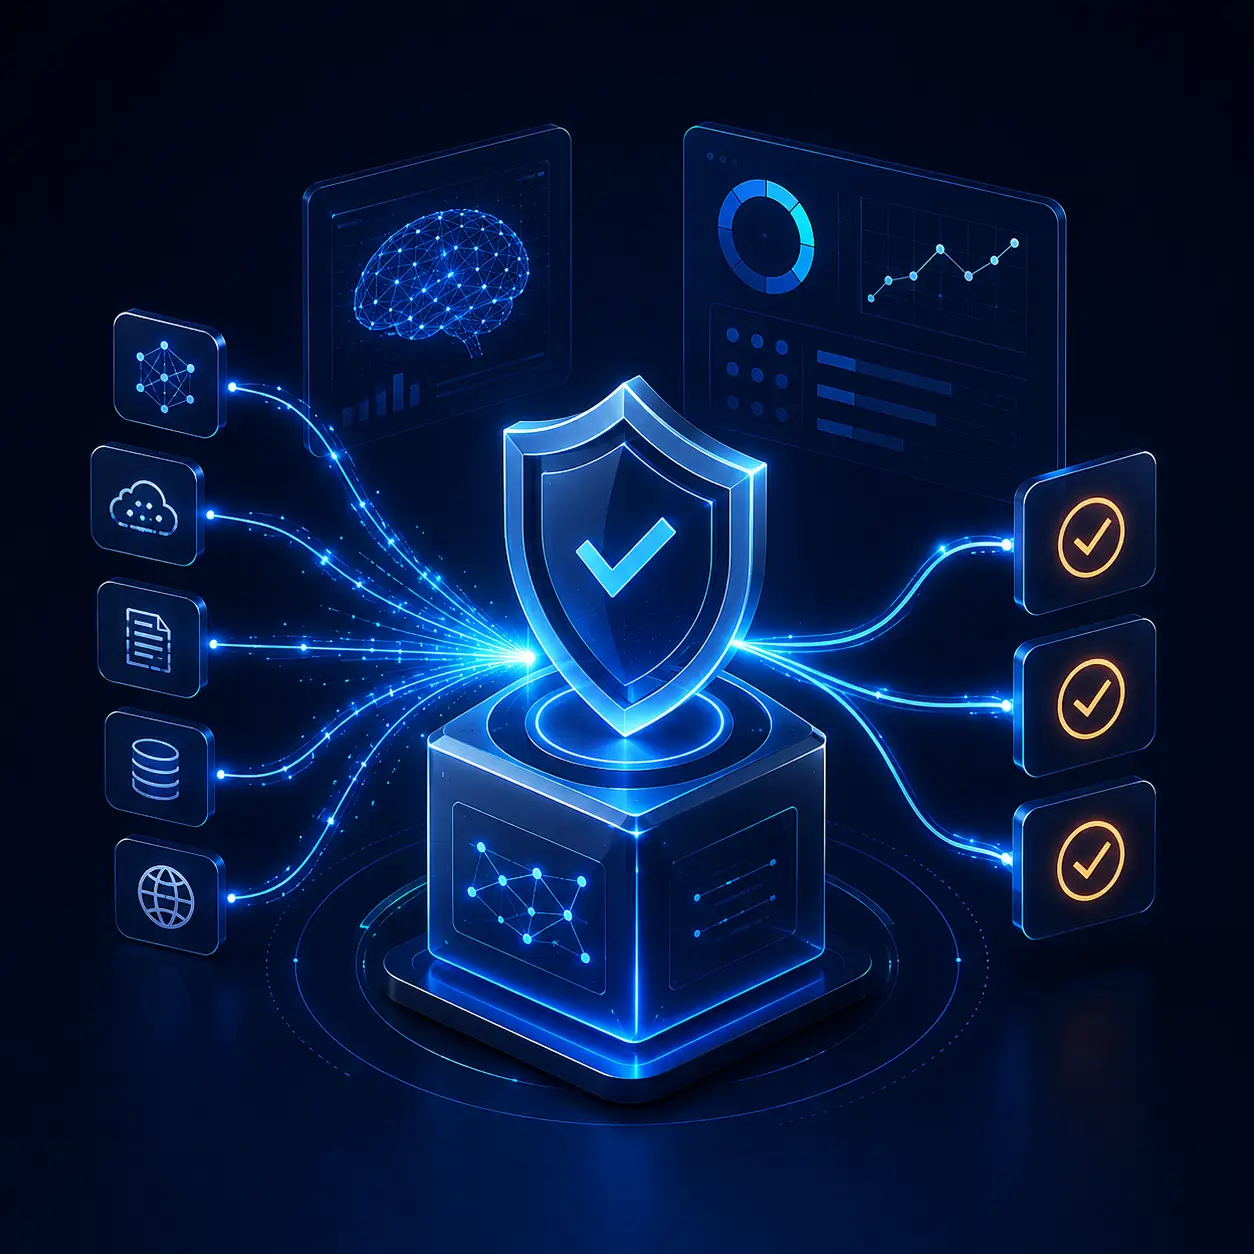
LLM observability illustration: data lines flowing into a shield with checklist items

You cannot govern what you cannot see

Scattered telemetry

Cost, latency and guardrail results sit in different tools, so nobody sees one request from end to end.

Agent runs are hard to follow

One agent task spans many model and tool calls, and plain application logs do not link them.

Logs can be edited

Ordinary logs can be changed without anyone noticing, which weakens them as audit evidence.

How LLM observability and audit work

Telemetry is captured where the traffic already flows: at the gateway that every model and tool call passes through. See how DeepintShield works.

Capture each request

Requests, responses, tokens, cost and latency are logged to SQLite by default or PostgreSQL.

Record each decision

Agent decisions are written to an append-only, hash-chained ledger before the call proceeds.

Export telemetry

OpenTelemetry, Prometheus, scheduled log exports and durable webhooks feed the tools you already run.

Verify the chain

Verify chain, in the console or through the API, recomputes the hashes and exposes any break.

Observability and audit features

OpenTelemetry

OTLP over HTTP or gRPC with GenAI conventions. Documented setups for Grafana Cloud, Datadog, New Relic, Honeycomb and Langfuse.

Prometheus metrics

Cost, cache hits, time to first token and inter-token latency, labelled by key, team, customer and routing rule.

Agentic observability

Runs, Decisions, Trends and Audit views, with each decision tagged against the OWASP Agentic Top 10.

Hash-chained ledger

Workspace-scoped and append-only. Production requires an HMAC key, so a database writer cannot quietly rebuild the chain.

Log exports

Daily, weekly or monthly exports to S3, Google Cloud Storage, Azure Blob, Snowflake, Redshift or BigQuery, including MCP tool logs.

Durable webhooks

At-least-once, HMAC-signed delivery of control-plane events, with idempotency keys, a dead-letter queue and replay.

Agentic observability covers agent decisions, which need Agentic Security on the Business plan and above.

One console for requests, cost and verdicts

AI Logs overview

Total requests, success rate, average latency, tokens and cost, a request-volume chart and the request list on one screen.
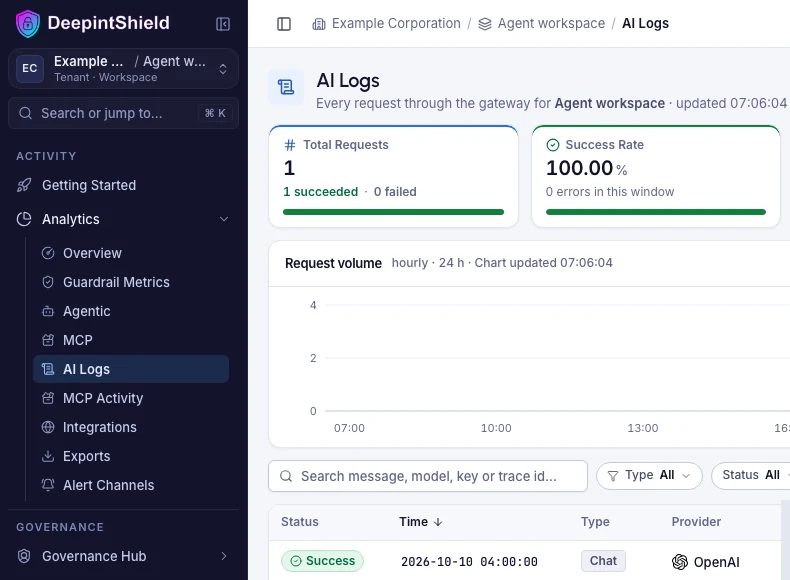
LLM observability in DeepintShield: AI Logs with total requests, success rate, a request-volume chart and the request list(opens the full-size image in a new tab)

OpenTelemetry and Prometheus

Send traces to any OpenTelemetry collector and expose metrics to Prometheus from Integrations › Observability. Turn on Disable Content Logging to keep prompt and response text out of the store.
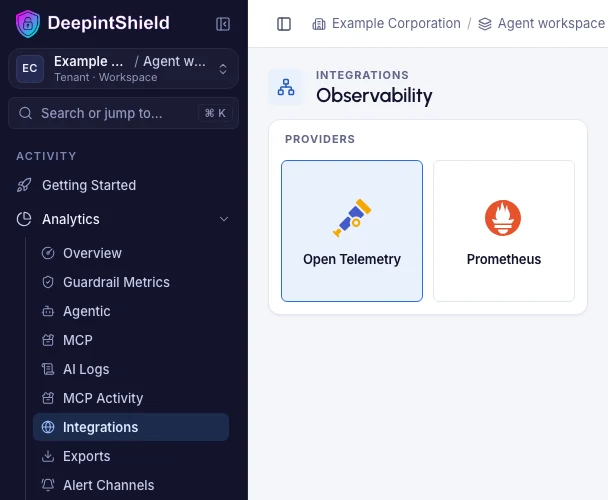
Observability integrations in the DeepintShield console: OpenTelemetry and Prometheus(opens the full-size image in a new tab)

Request detail

One request's timings, provider, model, virtual key, tokens, cost, input and response in a single panel, ready to share with a reviewer.
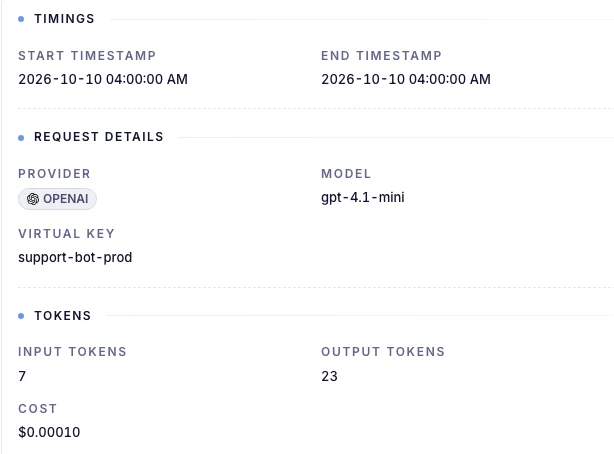
Request detail in DeepintShield AI Logs: timings, provider, model, virtual key, tokens and cost(opens the full-size image in a new tab)
Audit evidence that shows tampering

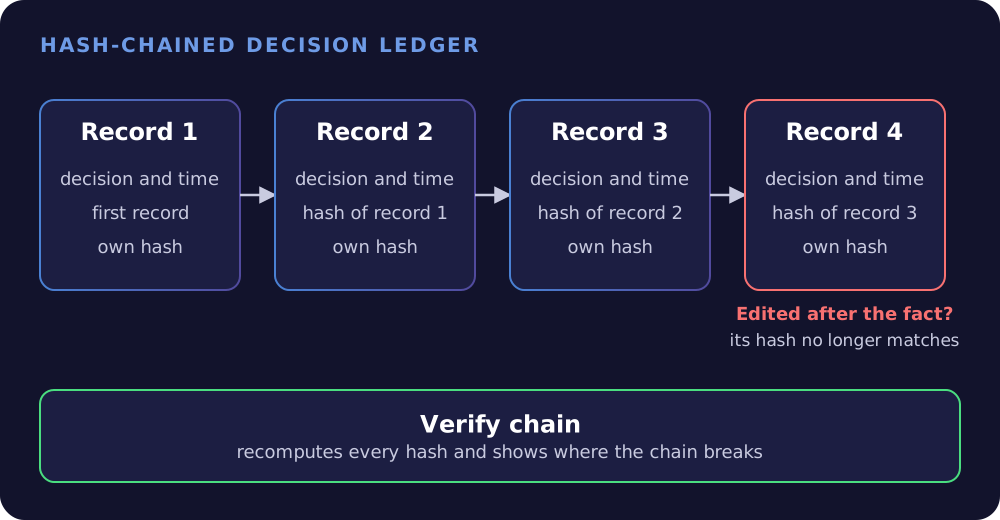
Each ledger record holds the hash of the record before it, so a change anywhere breaks the chain. The audit log is on by default and uses the CADF format with a SHA-256 hash chain. Tool arguments in agent decisions are stored as a cryptographic digest, and evidence is kept for 730 days by default. For framework mapping and auditor workflows, see AI Compliance.

  • Verify chain in the console and through an API
  • Production refuses to start without an HMAC key
  • JSON or CSV export for auditors
Hash-chained audit records: each record stores the previous record’s hash, so an edited record breaks the chain and Verify chain shows where(opens the full-size image in a new tab)
How hash-chained records link, and how a mismatch shows an edit.

Export to the tools you already use

The telemetry plugin is on by default and serves Prometheus metrics at /metrics; clusters can push to a Push Gateway instead. OpenTelemetry export uses OTLP over gRPC or HTTP, with a push interval of 15 seconds by default. Add your own Prometheus labels per request with x-deepintshield-prom-* headers.

Endpoints and metrics
# Prometheus scrape target
deepintshield-host:8080/metrics

# OpenTelemetry (OTLP)
4317   gRPC
4318   HTTP

# Example metrics
deepintshield_cost_total
deepintshield_cache_hits_total

Mapped to AI risk and audit frameworks

Mapped to

  • NIST AI RMF
  • ISO/IEC 42001
  • EU AI Act
  • OWASP Agentic Top 10
  • MITRE ATLAS

Audit logging supports SOC 2, GDPR, HIPAA and ISO 27001 evidence collection. Mapping supports your own assessment; it does not replace it.

Further reading on AI audit evidence

LLM observability questions

What is LLM observability?

LLM observability is the practice of recording and measuring what language-model applications do, from tokens and cost to tool calls and policy decisions. It lets platform, security and finance teams answer their questions from one set of data.

Where is trace data stored?

Logs are stored in SQLite by default, or in PostgreSQL, inside the deployment that serves your traffic. In hybrid and self-hosted modes, no data leaves your environment. Compare the deployment options.

Which tools does it integrate with?

Any OpenTelemetry backend over OTLP, with documented setups for Grafana Cloud, Datadog, New Relic, Honeycomb, Langfuse and self-hosted collectors, plus Prometheus. Scheduled log exports go to S3, Google Cloud Storage, Azure Blob, Snowflake, Redshift and BigQuery.

What makes an audit log tamper-evident?

Each record includes the hash of the record before it, so editing or deleting one breaks every later link. Verify chain recomputes the chain, and in production an HMAC key stops anyone with database access from rebuilding it unnoticed. Read the agentic observability docs.

How long is evidence kept?

Agent decision evidence is kept for 730 days by default, and you can change the retention period. Durable webhook deliveries are retained for 720 hours.

See every AI action in one place

Start free and send your first requests through the gateway, or book a demo to walk through the audit trail.

Start For Free